A useful tool to understand the accuracy of a sensor is its average error. It describes how far a sensor measurement deviates from the true value. For instance, if a temperature sensor has an average error of 2°C and measures 15°C, the real temperature lies probably somewhere between 13°C and 17°C. The lower the average error, the better the sensor performance. There are two parameters that are often used to quantify this: the Mean Absolute Error and the Root Mean Square Error. The following article will explain both parameters using illustrative examples.
Mean Absolute Error (MAE)
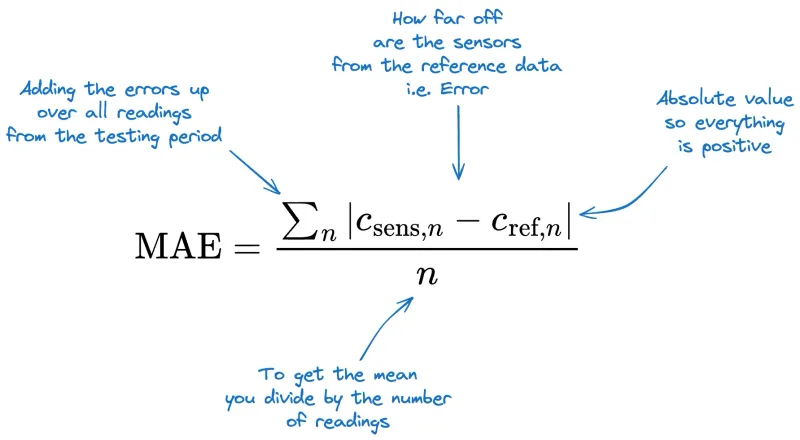
The MAE is the average absolute difference between a measurement of a sensor and the true value (reference measurement).
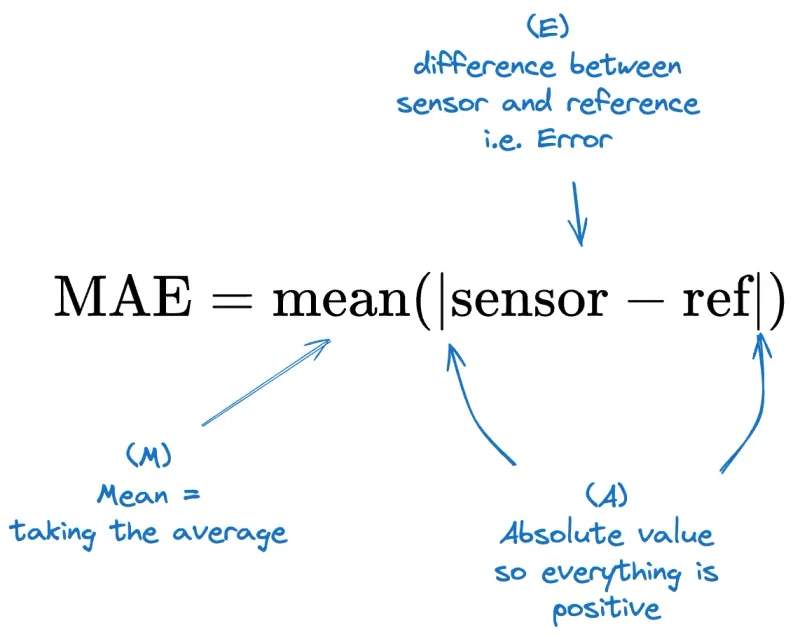
More scientifically expressed, the equation looks like this:
csens: Air pollutant concentration measured by sensor
cref: Air pollutant concentration measured by reference measurement (true value)
n: Number of measurements
Why Absolute?
The two vertical bars in the equation indicate taking the absolute difference between the sensor measurement and the true value. This ensures that, regardless of whether the sensor reading is higher or lower than the true value, the difference is always positive. Why this is so important is illustrated in Figure 1: The sensor (in black) sometimes registers values below and sometimes above the true value (in red). Consequently, the difference between the two measurements alternates above and below 0, as shown in the second panel of Figure 1.
Calculating the average of these differences, the negative and positive values cancel each other out, resulting in a very small error (0.2 µg/m³) which would misleadingly indicate a high sensor accuracy. If we instead take the absolute differences, i.e., we convert all negative differences to positive values, we end up with an average error (MAE) of 9 µg/m³ which reflects reality much better.
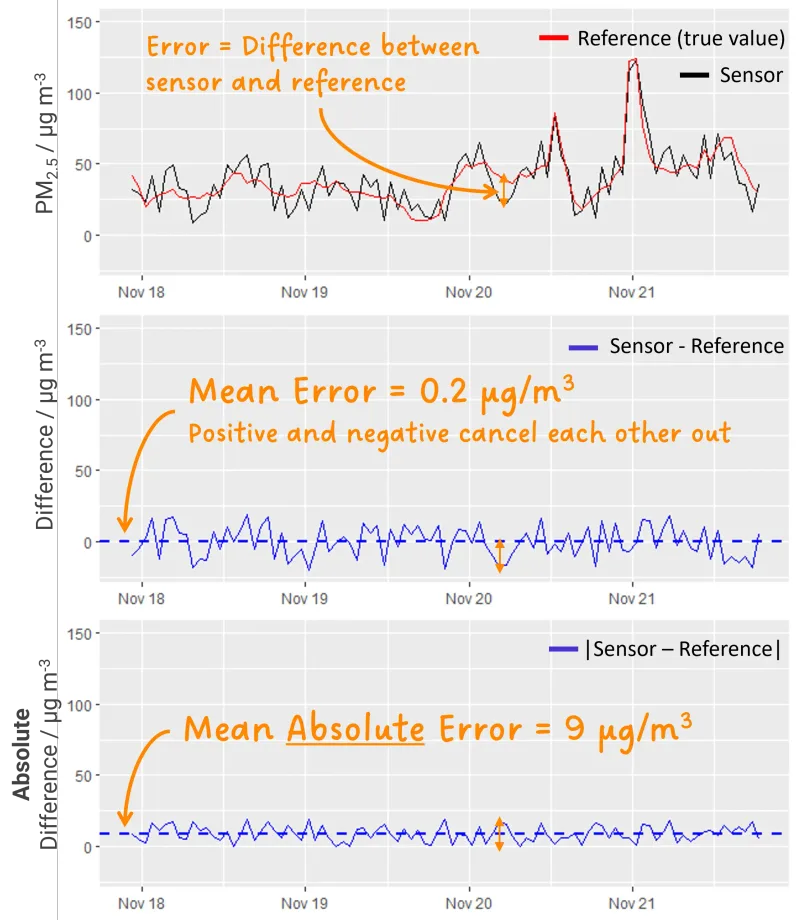
Figure 1: Top: (Fictive) example of a measurement from a PM sensor (black) compared to the true PM concentration measured by a reference sensor (red). Middle: Difference between the two measurements above with the dotted line indicating the average (= mean) difference. Bottom: Absolute difference between the two measurements above with the dotted line indicating the mean absolute difference
Root Mean Square Error (RMSE)
Instead of taking the absolute value of the error, one can also square it to get positive values. If you average these squared errors and take the square root of that average, you get the Root Mean Square Error (RMSE):
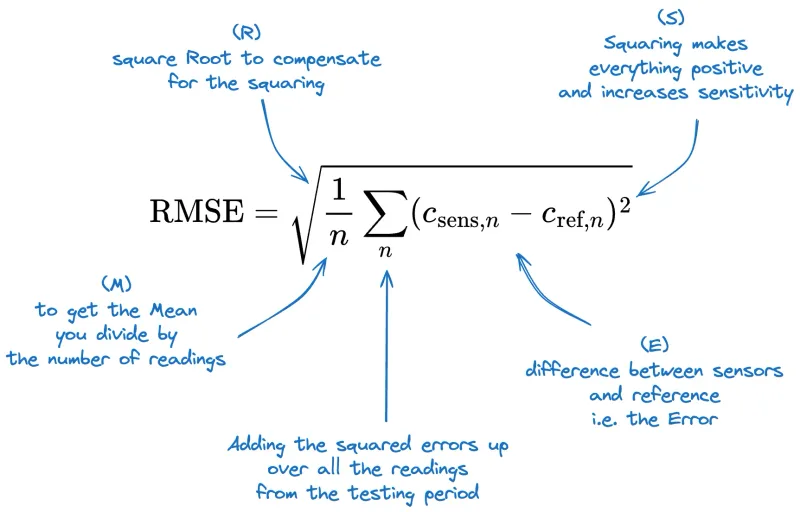
Don’t worry if you can't follow this calculation. The RMSE is most of the time very similar to the MAE.
Difference between RMSE and MAE
Basically, both values give you the same information: the average error of a sensor. It’s just that squaring the differences emphasizes larger errors, so the RMSE is more sensitive to outliers than the MAE. Figure 2 illustrates this graphically.
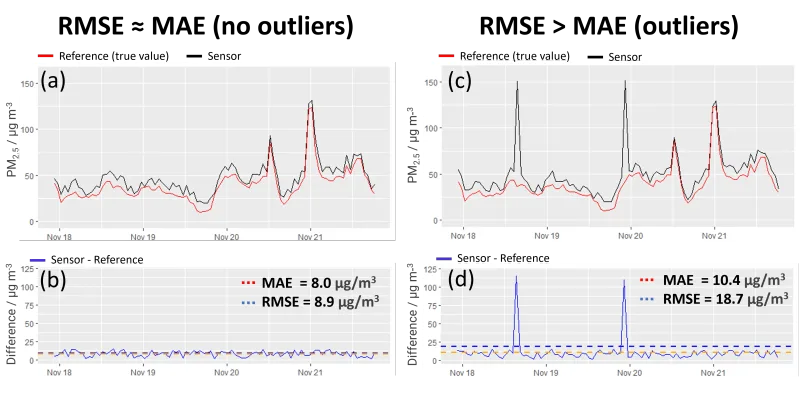
Figure 2: (Fictive) Comparison of sensor measurements with (left) and without outliers (right). The bottom panels illustrate that the MAE and RMSE are very similar when outliers don’t occur (Panel b). If the sensor measurements contain outliers, the RMSE becomes significantly larger than the MAE (Panel d).
The RMSE is always the same or higher than the MAE and therefore a “stricter” metric to assess the performance of a sensor. Therefore, AirGradient usually looks at the RMSE to characterize its monitors. This selection is also in accordance with the testing guidelines of the United States Environmental Protection Agency.
Good sensor vs. bad sensor
Look at the two top panels of Figure 3. Which of the two sensors would you use? Left or right? Most of you will probably pick the left sensor because its measurements are very close to the reference values (red line) whereas the right sensor is much “further away” from the red line. You intuitively see that the left sensor is more accurate. So well chosen!
The RMSEs reflect this: Not surprisingly, the RMSE (i.e., the average error) of the left sensor is lower than the RMSE of the right sensor. The lower the RMSE, the better the sensor performance. A perfect sensor (that exactly measures the true concentrations of a pollutant) would have an RMSE of 0.
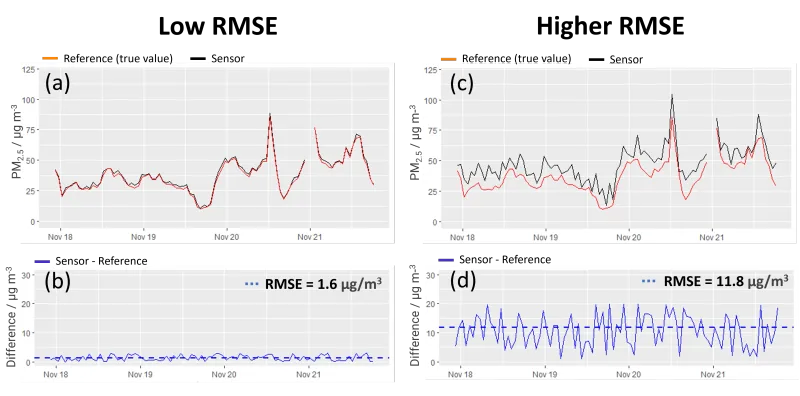
Figure 3: PM2.5 measurements of a relatively accurate (left) and a less accurate low-cost sensor (right). The top panels (a) and (c) show time plots of the PM2.5 concentrations measured by a sensor (black), compared against the “true” values measured by a reference sensor (red). The bottom panels (b) and (d) show time plots of the difference between the two measurements above. The dotted line marks the RMSE.
Normalized Root Mean Square Error (nRMSE)
Now, which of the two sensors in Figure 4 would you use? Left or right? Considering the RMSE, both sensors have pretty much the same error. Yet, you would probably go for the right sensor, true? That’s because this one has a lower relative error.
Have a closer look at the pollution levels the two sensors in Figure 4 are exposed to. The particulate matter (PM) concentrations on the right are 10 times higher than on the left. An RMSE (see lower panels) of ca. 7 µg/m³ has a much larger impact on the measurements in the less polluted environment. If we just looked at the RMSE, we would be misled to think that both sensors perform equally well. Here is where the nRMSE comes into play. It is useful for comparing the performance of sensors across environments with different pollution levels. It’s less useful for temperature and humidity sensors.
The nRMSE is calculated by normalizing the RMSE, that means by dividing it by the average (true) measurement value during the testing interval. In our example, this would be the average PM concentration that was measured while the sensor was tested. In the bottom of Figure 4 you can see the calculation of the nRMSE for the polluted and less polluted environment. The sensor in the less polluted environment has an nRMSE of 66%, indicating that its measurements were on average 66% off the true concentration. The sensor in the polluted environment was on average wrong by 6%. So, relatively speaking, the right sensor is more accurate than the left one.
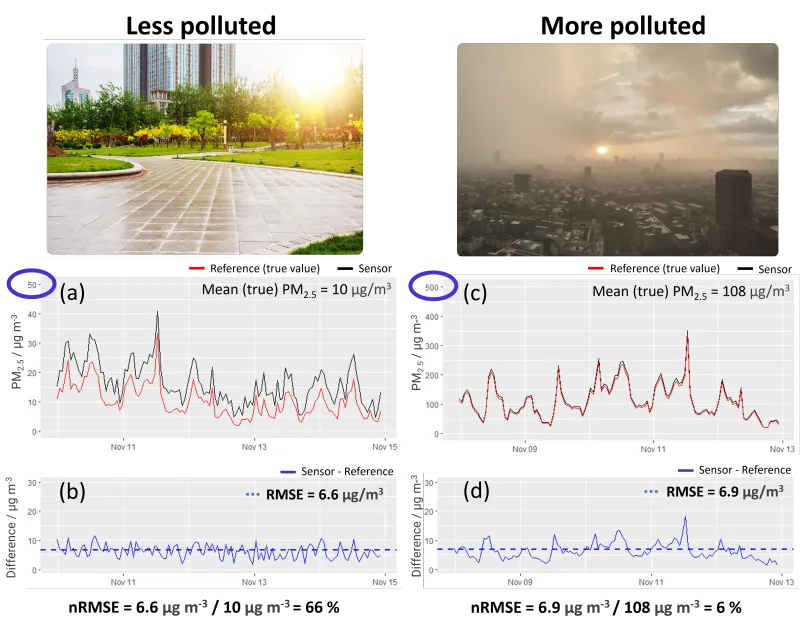
Figure 4: Comparison between sensor and reference measurement in a less polluted (left) and a more polluted environment (right; note the different scale of the y-axis). The nRMSE is calculated at the bottom.
What’s an acceptable error?
You can find target values for the performance of low-cost PM2.5 Air Sensors in the testing guidelines of the United States Environmental Protection Agency (US EPA). For 24h averaged data they recommend an RMSE of max. 7 μg/m³ or an nRMSE of max. 30% (either of the two criteria is sufficient to meet the target).
So it’s okay when a sensor reading is 30% off the real value. Isn’t that a lot?
All sensing methods, including the high standard reference-grade instruments, have their limitations. If you compare two reference instruments, they should ideally measure exactly the same, namely the true pollutant concentration. But they don’t: A study from the US-EPA co-located two commonly used reference instruments (Met One BAM-1020 and Teledyne API T640) and found that, at certain concentration ranges, they diverged by over 25% from each other.
Don’t get us wrong; reference-grade instruments remain the gold standard in air quality measurements. When operated correctly, they are more reliable and accurate than low-cost sensors. However, it's important to acknowledge that all measurements entail a degree of uncertainty. Low-cost sensors have many other advantages over reference-grade instruments e.g. their small size, easy setup and maintenance, and their low costs of course. To be able to benefit from these advantages, a slightly lower accuracy is tolerated.
Summary
- All parameters, MAE, RMSE and nRMSE, give information about the average error of a sensor, i.e. how far the sensor measurements are from the true value.
- The closer these values are to 0, the better the sensor performance.
- The RMSE is a “stricter” criterion because it is more sensitive to outliers.
- The relative error (e.g. nRMSE) is useful to compare the performance of sensors across environments with different pollution levels. It’s less useful for temperature and humidity sensors.
- The US-EPA recommends the use of RMSE and nRMSE to characterize the average error of a sensor.
- For PM2.5, measurement deviations of up to RMSE = 7 μg/m³ or nRMSE = 30% are acceptable.
- Even measurements from reference-grade instruments have uncertainties.
Questions & Comments?
If you have any questions or comments on this topic? Head over to the AirGradient Forum for discussions.